[ccfic caption-text format="plaintext"]
By James Kinneen
Hometown Weekly Reporter
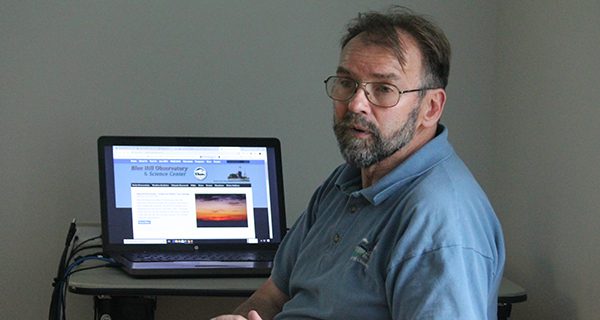
Last Tuesday at Needham’s Center at the Heights, Don McCasland, the program director at Blue Hill Observatory Science Center, spoke to the seniors on a variety of meteorological topics, ranging from climate change to the various issues that can arise when weather detection equipment is mishandled.
While the presentation was not about climate change, it was inevitable that the subject would come up. While there are many tools to determine that the climate is warming globally (McCasland explained the difference between weather and climate, with weather being “what you’re getting” and climate being “what you’re expecting”), the ones at the Blue Hills Observatory are very easy to understand.
Rather than doing things like observing tree rings to determine the years there were times of draught, or drilling into ice cores to determine snowfall over the centuries, the Blue Hill Observatory uses the same types of tools to measure things like temperature and precipitation levels that they have since 1885.
What that means, in a nutshell: the Observatory provides “the most homogeneous climate record in North America.”
And, unsurprisingly, this climate record shows it’s getting hotter. McCasland showed a variety of charts that verified this idea, ranging from annual temperature charts and first thaw charts, to a graph that showed blueberries were ripening far faster than they have in the past.
While it wasn’t surprising to learn that the weather at the Blue Hills Observatory was following global trends, McCasland did make note of a couple trends about which people are likely unaware. For example, McCalsand explained that precipitation levels have become far more erratic than ever before, with large storms interspersed with times of very little precipitation.
Citing the winter of 2014 as an example, he explained: “The highs are much higher, and the lows are much lower in recent years. Instead of having 48 one-inch storms in a year, we might have twelve four-inch storms.”
The wind was another issue McCasland highlighted that receives very little attention. At the Observatory, wind speeds have gone down consistently since the 1930s, but have been absolutely plummeting since the 1980s. According to McCasland, the drop in wind speed from the 30s to the 80s is largely attributed to farms being abandoned and turned back into forests, but the huge drop beginning in the 1980s is likely due to the warming climate.
“One of the ways wind is formed is when cold air meets warm air. If there’s less cold air, there’s going to be less wind,” he noted.
But lest you think everything about the climate is changing, McCasland showed a chart that has been relatively consistent since the 1800s: the “annual bright sunshine” chart, which showed the number of sunny days has been pretty stable, despite the other fluctuations.
The science of climate change can be daunting and confusing, but McCasland could not have made it any clearer. Using the same tools since the 1800s, the Blue Hill Observatory has proven it’s getting hotter.
And that the information the observatory provides is invaluable.